Bitcoin MVRV Z-Score Explained: Why the Classic Top Signal Stopped Working
The MVRV Z-Score is probably the most shared Bitcoin cycle chart on the internet. The usual story is simple: when the indicator goes into the red band above 7, the top is in; when it drops below zero, it is time to buy. That story was true for a long time. Our data says that half of it no longer is.
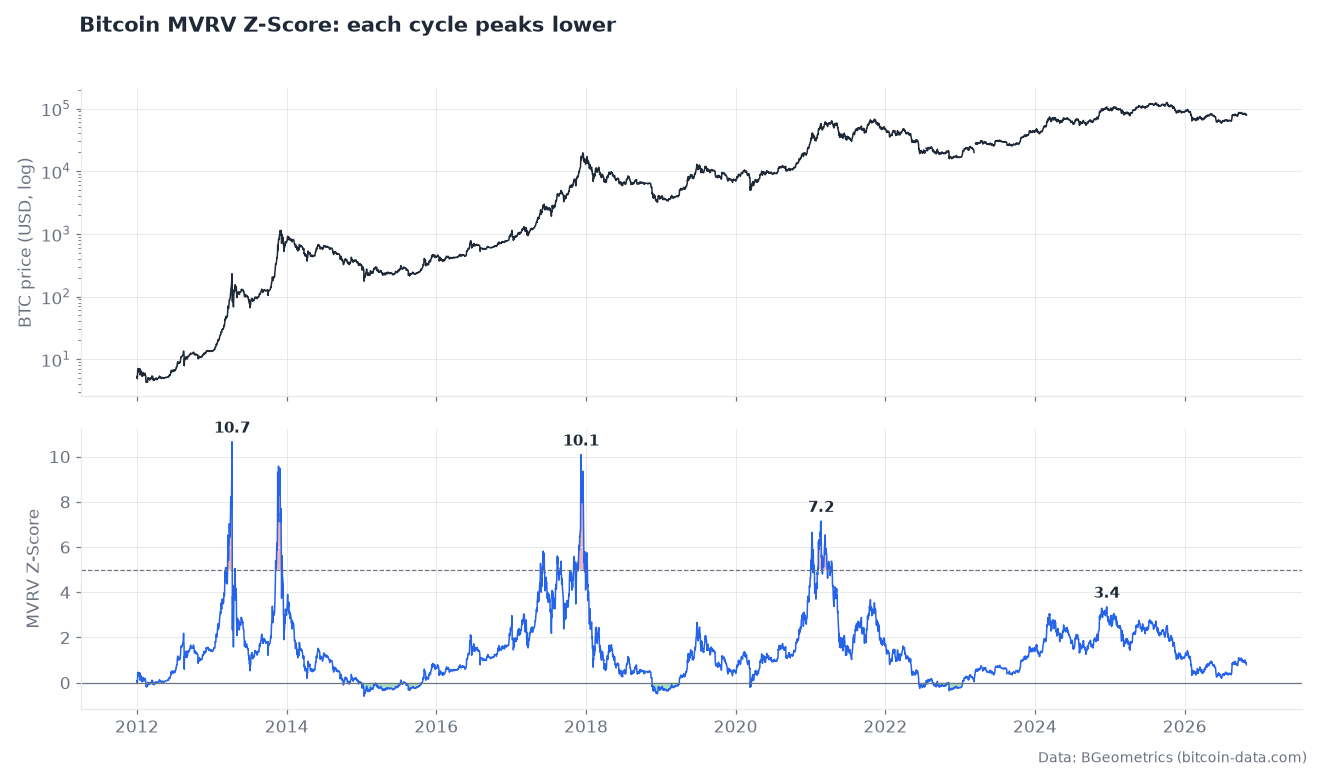
This guide explains what the Z-Score measures, how it is built, and what it has actually done in every cycle since 2012, using the full history behind the BGeometrics MVRV Z-Score chart.
What MVRV measures
MVRV compares two ways of valuing every bitcoin in circulation:
- Market value (market cap): every coin priced at today’s price.
- Realized value (realized cap): every coin priced at the moment it last moved on-chain. It is a good approximation of what holders, in aggregate, paid for their coins.
The ratio between them is the MVRV Ratio:
MVRV = Market Cap / Realized Cap
An MVRV of 2 means the average coin is worth twice what it cost: holders sit on a 100% unrealized profit. An MVRV below 1 means the average holder is underwater. We covered the ratio in Reading the MVRV Ratio; this post focuses on the Z-Score.
How the Z-Score is calculated
The Z-Score takes the gap between market value and realized value and expresses it in standard deviations of market value:
MVRV Z-Score = (Market Cap − Realized Cap) / std(Market Cap)
The point of dividing by the standard deviation is to make extremes comparable: a gap of $500 billion means something very different in a $200 billion market than in a $2 trillion one.
What it did in every cycle
| Cycle | Price top | Z-Score at the top | Highest Z-Score of the cycle | Bear market low (Z-Score) |
|---|---|---|---|---|
| 2013 | Dec 4, 2013 · $1,135 | 7.7 | 10.7 (Apr 2013) | Jan 14, 2015 · −0.60 |
| 2017 | Dec 16, 2017 · $19,641 | 9.4 | 10.1 (Dec 2017) | Dec 15, 2018 · −0.49 |
| 2021 | Nov 8, 2021 · $67,542 | 3.5 | 7.2 (Feb 2021) | Nov 9, 2022 · −0.36 |
| 2025 | Oct 6, 2025 · $124,824 | 2.5 | 3.4 (Dec 2024) | Jun 30, 2026 · +0.20 (low so far) |
Two patterns stand out.
The top signal has been decaying for three cycles. In 2013 and 2017 the Z-Score went above 9 right at the top. In 2021 it peaked at 7.2 in February, but the actual price top nine months later came with a reading of just 3.5. In the last cycle it never even reached 5: the highest reading was 3.4 in December 2024, and Bitcoin topped at $124,824 in October 2025 with a Z-Score of 2.5. Anyone waiting for the “red band” sold nothing.
The bottom signal has been far more reliable. Every bear market low from 2015 to 2022 came with a Z-Score below zero, within days of the price bottom. The Z-Score was negative for 284 days in 2015, 134 days across 2018-2019 and 167 days in 2022. The 2026 drawdown is the first exception so far: the price low of $58,525 on June 30, 2026 came with a Z-Score of +0.20, never crossing zero.
Why the peaks keep getting lower
There is a mechanical reason, not just a narrative one. The denominator of the Z-Score is the standard deviation of market cap, and as Bitcoin’s market cap grows by orders of magnitude, that standard deviation grows with it. Every new cycle starts from a bigger base, so the same percentage move produces a smaller Z-Score.
On top of that, the market itself has changed: lower volatility, more coins held by ETFs and companies that rarely move, and less of the retail mania that produced the 2013 and 2017 blow-off tops. The realized cap now catches up with the price much faster than it used to.
What the Z-Score says about forward returns
Taking every day since 2012 and looking at the Bitcoin price one and two years later:
| MVRV Z-Score | Days | Median 1-year return | % positive after 1 year | Median 2-year return |
|---|---|---|---|---|
| Below 0 | 662 | +98% | 99% | +488% |
| 0 to 1 | 1,695 | +113% | 82% | +316% |
| 1 to 3 | 2,439 | +69% | 61% | +94% |
| 3 to 5 | 417 | +44% | 62% | +57% |
| Above 5 | 203 | −20% | 33% | −49% |
| All days | 5,416 | +86% | 71% | +210% |
The direction is clear: the lower the Z-Score, the better the forward returns. A word of caution, though: these are overlapping daily observations from only a handful of independent episodes (three bear markets explain almost all of the days below zero), so the percentages look more precise than they are. And the 3-5 bucket, which contained the last two cycle tops, still shows positive median returns because most of its days happened mid-cycle.
How to use the MVRV Z-Score today
- Use it for bottoms, not tops. Readings below 0, and to a lesser extent between 0 and 1, have historically been the best long-term entry zones.
- Do not wait for a fixed number at the top. Compare the current reading with the range of the current cycle rather than with 2013 or 2017. A Z-Score rolling over from its cycle high while price keeps rising is more useful than any absolute threshold.
- Combine it with cohort data. STH-MVRV and LTH-MVRV show which group is in profit, and SOPR shows whether they are actually selling. Our SOPR guide covers that side.
As of October 29, 2026, the MVRV Z-Score stood at 0.80 and the MVRV Ratio at 1.46, with Bitcoin at about $78,000: in the 0-1 bucket, which has historically been one of the best zones in the table above, but above the sub-zero readings that marked previous cycle bottoms.
FAQ
What is a good MVRV Z-Score to buy Bitcoin? Historically, readings below 0 have marked cycle bottoms, and the 0-1 range has also produced strong forward returns. Neither is a guarantee: the 2026 low never went below zero.
What MVRV Z-Score signals a top? There is no reliable fixed level anymore. Tops came at 9.4 in 2017, 3.5 in 2021 and 2.5 in 2025.
Where can I get the data? The chart is free at charts.bgeometrics.com/mvrv.html, and the full daily history is available through the BGeometrics API.
Data: BGeometrics, daily history 2012 to October 29, 2026. Not investment advice.
See the metrics in this article live
Free interactive charts, or full historical access with a paid plan.