Bitcoin SOPR Explained: Reading Profit-Taking and Capitulation On-Chain
Price tells you what Bitcoin is worth today. It does not tell you whether the people selling are taking profits or capitulating. That is what SOPR, the Spent Output Profit Ratio, measures: for every coin that moves on-chain, was it sold above or below the price it was bought at?
This guide explains how SOPR works, how to read its short and long term holder versions, and what the full history behind the BGeometrics SOPR chart says about its most famous rule: SOPR = 1.
How SOPR is calculated
Every bitcoin transaction spends outputs (UTXOs) that were created at some point in the past. SOPR values each spent output twice: at the price on the day it was spent, and at the price on the day it was created. Summing all the outputs spent that day:
SOPR = Value of spent outputs at spending price / Value of the same outputs at creation price
- SOPR above 1: on average, coins moved that day were sold at a profit.
- SOPR below 1: on average, coins moved that day were sold at a loss.
- SOPR = 1: coins moved at break-even.
Daily SOPR is noisy, so most analysts look at a 7 or 30-day average, both available on the chart.
Bull markets and bear markets look very different
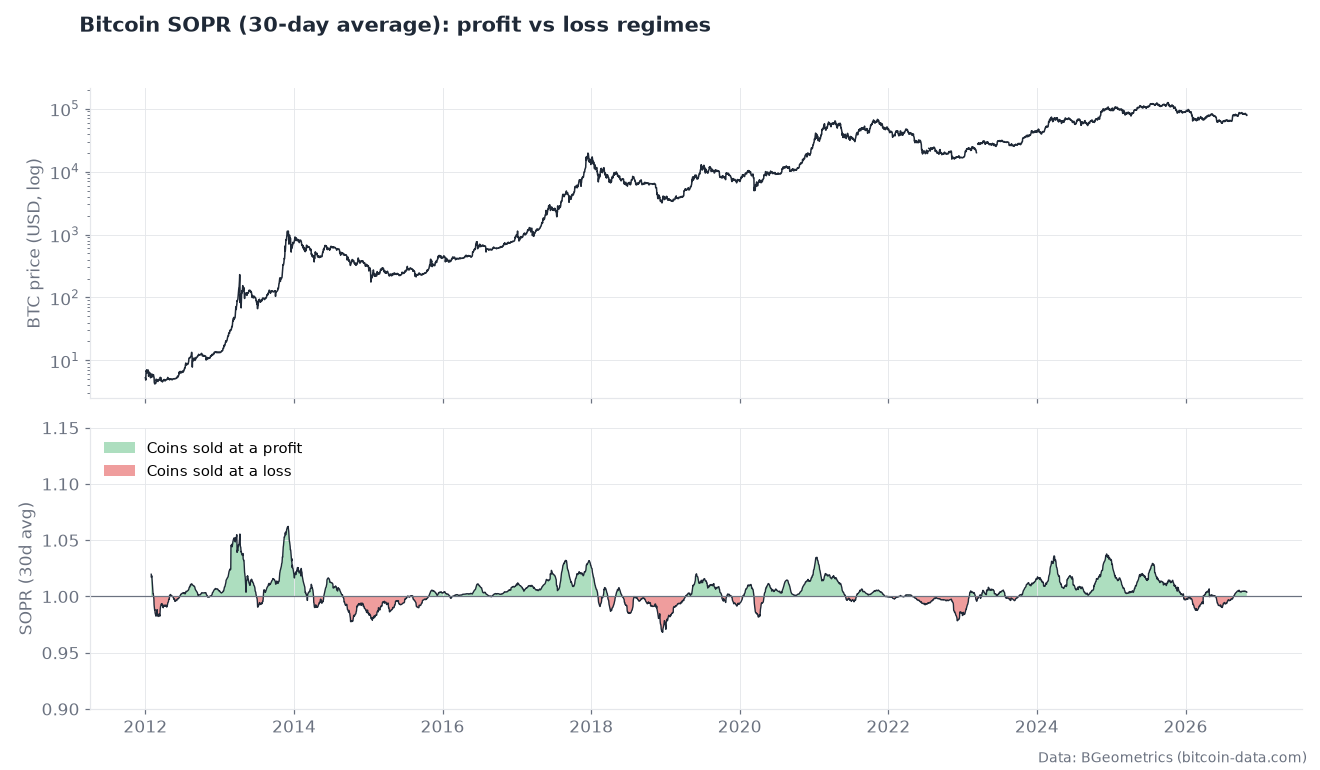
The share of days with SOPR below 1 is one of the cleanest ways to see the market regime:
| Year | Days with SOPR below 1 | Year | Days with SOPR below 1 | |
|---|---|---|---|---|
| 2013 (bull) | 14% | 2014 (bear) | 56% | |
| 2017 (bull) | 5% | 2015 (bear) | 67% | |
| 2020 (bull) | 19% | 2018 (bear) | 68% | |
| 2021 (bull) | 21% | 2022 (bear) | 77% | |
| 2024 (bull) | 10% | 2026 (to Oct 29) | 55% |
In bull markets, holders are almost always selling at a profit. In bear markets, they spend most of the year selling at a loss. With 55% of days below 1 so far, 2026 looks much more like a bear year than a bull year.
Why SOPR = 1 matters
The break-even line works as a behavioural boundary:
- In bull markets it acts as support. When price dips and SOPR approaches 1, holders refuse to sell at break-even, selling pressure dries up and SOPR bounces off 1.
- In bear markets it acts as resistance. When price recovers and SOPR approaches 1, holders who have been underwater for months take the chance to exit at break-even, and the rally stalls.
That is why the moment SOPR reclaims 1 after a long period below it gets so much attention: it suggests the market has stopped selling at a loss.
Is reclaiming SOPR = 1 a buy signal?
We tested it. We looked for every time the 7-day average of SOPR crossed above 1 after spending at least 70% of the previous 60 days below it, and measured the Bitcoin price 6 and 12 months later:
| Date | Price | 6 months later | 12 months later |
|---|---|---|---|
| Mar 15, 2012 | $5 | +111% | +778% |
| May 22, 2014 | $527 | −29% | −54% |
| Nov 12, 2014 | $423 | −43% | −20% |
| Mar 14, 2015 | $284 | −16% | +45% |
| Jul 26, 2015 | $293 | +30% | +123% |
| Jul 20, 2018 | $7,327 | −51% | +48% |
| Dec 4, 2018 | $3,893 | +125% | +85% |
| Jan 7, 2020 | $8,136 | +12% | +350% |
| Jul 17, 2021 | $31,548 | +35% | −33% |
| Feb 4, 2022 | $41,080 | −43% | −43% |
| Aug 2, 2022 | $23,031 | +3% | +27% |
| Jan 15, 2023 | $20,876 | +45% | +104% |
| Sep 18, 2023 | $26,475 | +147% | +128% |
| Mar 29, 2026 | $65,967 | +27% | n/a |
| Aug 21, 2026 | $78,359 | n/a | n/a |
The best entries in Bitcoin’s history are on this list: December 2018, January 2023 and September 2023. So are some of the worst: May 2014 and February 2022, both followed by a further 43-54% decline. Five of the fourteen signals with six months of data were losing after six months.
The honest conclusion: reclaiming SOPR = 1 is a necessary condition for a new bull market, not a sufficient one. In a deep bear market the first reclaims are usually bear market rallies that get rejected at 1 again. It works much better as confirmation, combined with valuation metrics like the MVRV Z-Score, than as a standalone trigger. If you want to see how rules like this hold up out of sample, BG Lab backtests on-chain trading rules on data they never saw.
STH-SOPR and LTH-SOPR
Splitting SOPR by how long coins were held separates two very different kinds of seller:
- STH-SOPR only counts coins held for less than 155 days. These holders are sensitive to price: STH-SOPR falls below 1 on almost every correction, even in bull markets, and it is where capitulation shows up first. It was below 1 on 47% of days in 2025 and 54% so far in 2026.
- LTH-SOPR only counts coins held for more than 155 days. Long term holders sell into strength, so LTH-SOPR spikes when they distribute near cycle tops.
The LTH-SOPR peaks tell the same story as the MVRV Z-Score: each cycle the profit taken by long term holders is smaller, and it arrives earlier. The 30-day average of LTH-SOPR peaked at 24.8 in December 2013 and 17.3 in January 2018, both within weeks of the price top. In 2021 it peaked at 7.8 in April, seven months before the November top. In the last cycle it peaked at 3.4 in June 2024, sixteen months before the October 2025 top.
Where SOPR stands now
On October 29, 2026, SOPR was 0.994, STH-SOPR 0.999 and LTH-SOPR 0.84, with Bitcoin at about $78,000. Since August SOPR has stayed in a tight band around 1 (7-day average between 0.995 and 1.012), slightly above it on three out of four days: neither the profit taking of a bull market nor the capitulation of a bear market bottom. The level to watch is whether dips keep bouncing off 1 (support, bullish) or rallies keep failing there (resistance, bearish).
FAQ
What is a good SOPR value? There is no good or bad value on its own. Above 1 means profit taking, below 1 means selling at a loss; what matters is how SOPR behaves around 1 in the current regime.
What is the difference between SOPR and MVRV? MVRV measures the unrealized profit of all coins, including those that never move. SOPR only measures the coins that are actually spent, so it reflects realized behaviour.
Where can I get SOPR data? The charts are free at charts.bgeometrics.com/sopr.html, and the full daily history of SOPR, STH-SOPR and LTH-SOPR is available through the BGeometrics API.
Data: BGeometrics, daily history 2012 to October 29, 2026. Not investment advice.
See the metrics in this article live
Free interactive charts, or full historical access with a paid plan.