It is easy to find multiple sites on the web where they recommend using the RSI (Relative Strength Index) indicator to perform a technical analysis of the price of an asset.
So we are going to examine how one of the most used strategies with this indicator in the last three years has behaved in the case of bitcoin.
The Relative Strength Index (RSI) is a technical indicator that measures the speed and change of price movements, it was developed by J. Welles Wilder.
The RSI moves from 0 to 100 and the most common strategy is to open a long position (buy stocks) if the RSI indicator rises above the 30 level from below because at that time the stocks are considered oversold and if the RSI of the stock crosses the 70 level from above a short position must be entered (selling shares) because the stock is considered to be overbought.
The calculation process to calculate this metric is as follows:
- The closing price for the last 14 days is tracked.
- It is determined whether the closing price of the current day is higher or lower than that of the previous day.
- The average profit or loss for the last 14 days is calculated.
- The relative strength is calculated, RS = AvgGain / AvgLoss
- The relative strength index is calculated, RSI = 100 – 100 / (1 + RS)
We are going to carry out a Python program where we will perform a backtest to see if it would have been worth acting as indicated by the RSI.
We import the necessary libraries
import pandas as pd
import numpy as np
from datetime import datetime
from pandas_datareader.data import DataReader
import matplotlib.pyplot as plt
from math import floor
from termcolor import colored as cl
Obtain the data of the price of bitcoin in the last 3 years
start = datetime(2019,1,1)
end = datetime(2021,12,31)
df = DataReader('BTC-USD', 'yahoo', start, end)
Calculate the RSI using the exponential moving average in a period of 14 days
periods = 14
df['close_delta'] = df['Close'].diff()
df['gain'] = df['close_delta'].clip(lower=0)
df['loss'] = -1 * df['close_delta'].clip(upper=0)


df['ema_up'] = df['gain'].ewm(com=periods -1, adjust=True).mean()
df['ema_down'] = df['loss'].ewm(com=periods -1, adjust=True).mean()
df['rs'] = df['ema_up']/df['ema_down']
df['rsi'] = 100-(100/(1+df['rs']))
Show the results
plt.style.use('fivethirtyeight')
plt.rcParams['figure.figsize'] = (20, 10)

ax1 = plt.subplot2grid((10,1), (0,0), rowspan = 4, colspan = 1)
ax2 = plt.subplot2grid((10,1), (5,0), rowspan = 4, colspan = 1)
ax1.plot(df['Close'], linewidth = 2.5)
ax1.set_title('BTC CLOSE PRICE')
ax2.plot(df['rsi'], color = 'orange', linewidth = 2.5)
ax2.axhline(30, linestyle = '--', linewidth = 1.5, color = 'grey')
ax2.axhline(70, linestyle = '--', linewidth = 1.5, color = 'grey')
ax2.set_title('BTC RELATIVE STRENGTH INDEX')
plt.show()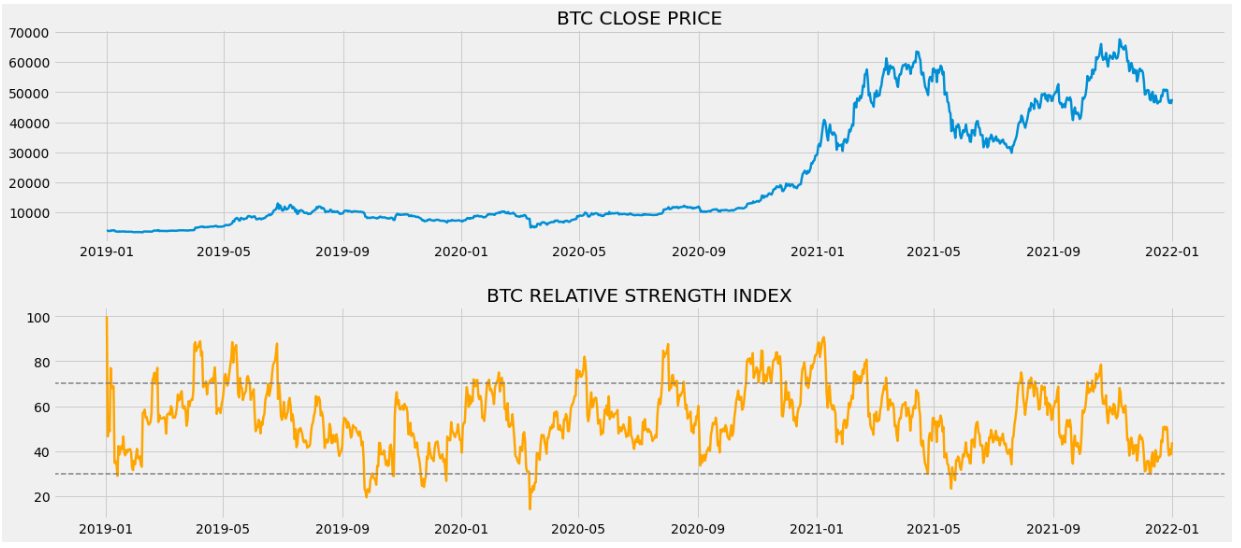
Implement the strategy 30 70
df['return'] = df['Close']/df['Close'].shift(1)
df['signal'] = np.where((df['rsi'] < 30),1,np.nan)
df['signal'] = np.where((df['rsi'] > 70),0,df['signal'])
df['signal'].ffill(inplace=True)
df['strategy'] = df['return'] ** df['signal'].shift(1)
Graph showing the trajectory of the strategy followed
plt.rcParams.update(plt.rcParamsDefault)
df[['strategy']].dropna().cumprod().plot(figsize=(10,6))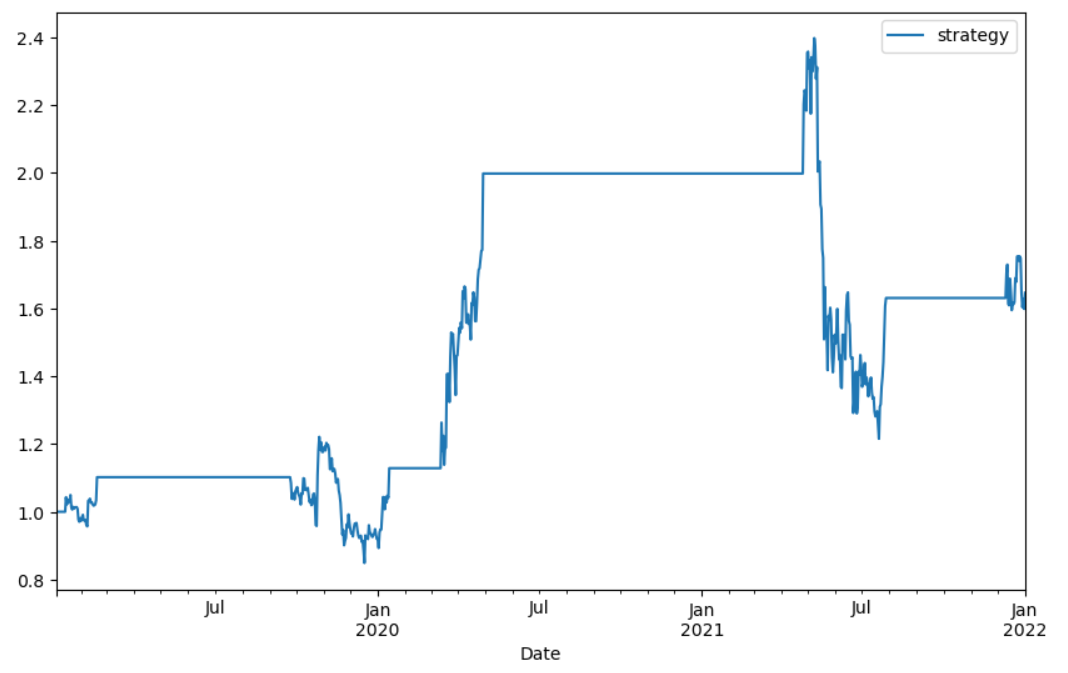
Now we are going to buy that profit with the evolution of the price of bitcoin.
df[['return','strategy']].dropna().cumprod().plot(figsize=(10,6))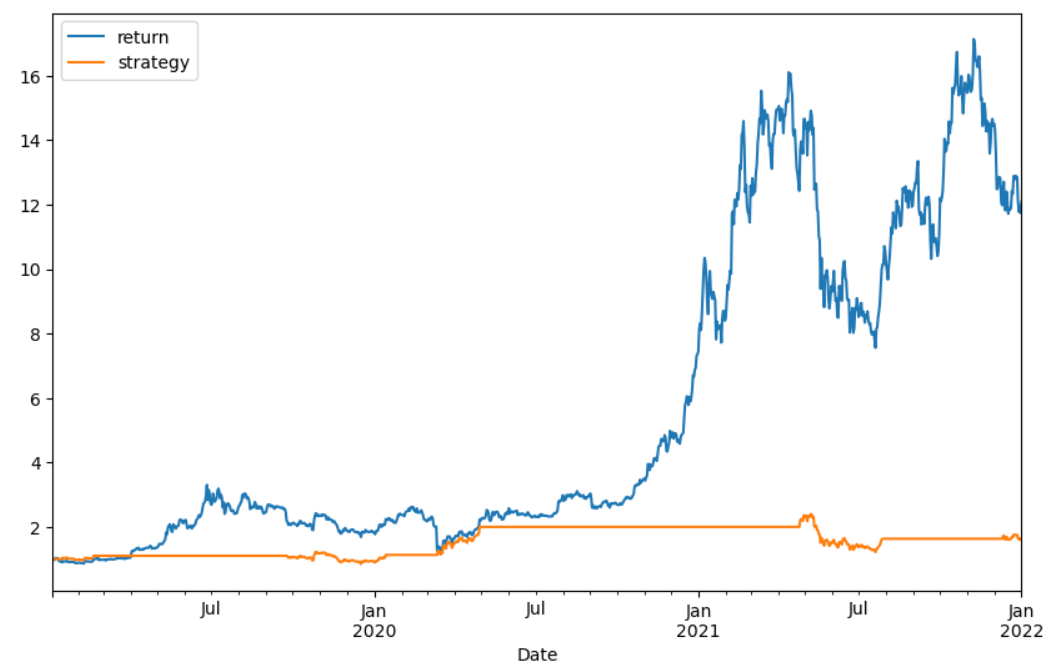
Not counting the first 4 months of 2019 where the price performance is similar to that of the strategy followed with the RSI, the rest of the time the profit is much higher if we had bought and held the BTC.
Python code (notebook) on github: Bitcoin, it is better to follow the RSI or buy and hodl
Categories: Bitcoin, BTC, Code, Hodl, Price, Python, Script, Trader, Trading
Leave a Reply